Hashtags network analysis
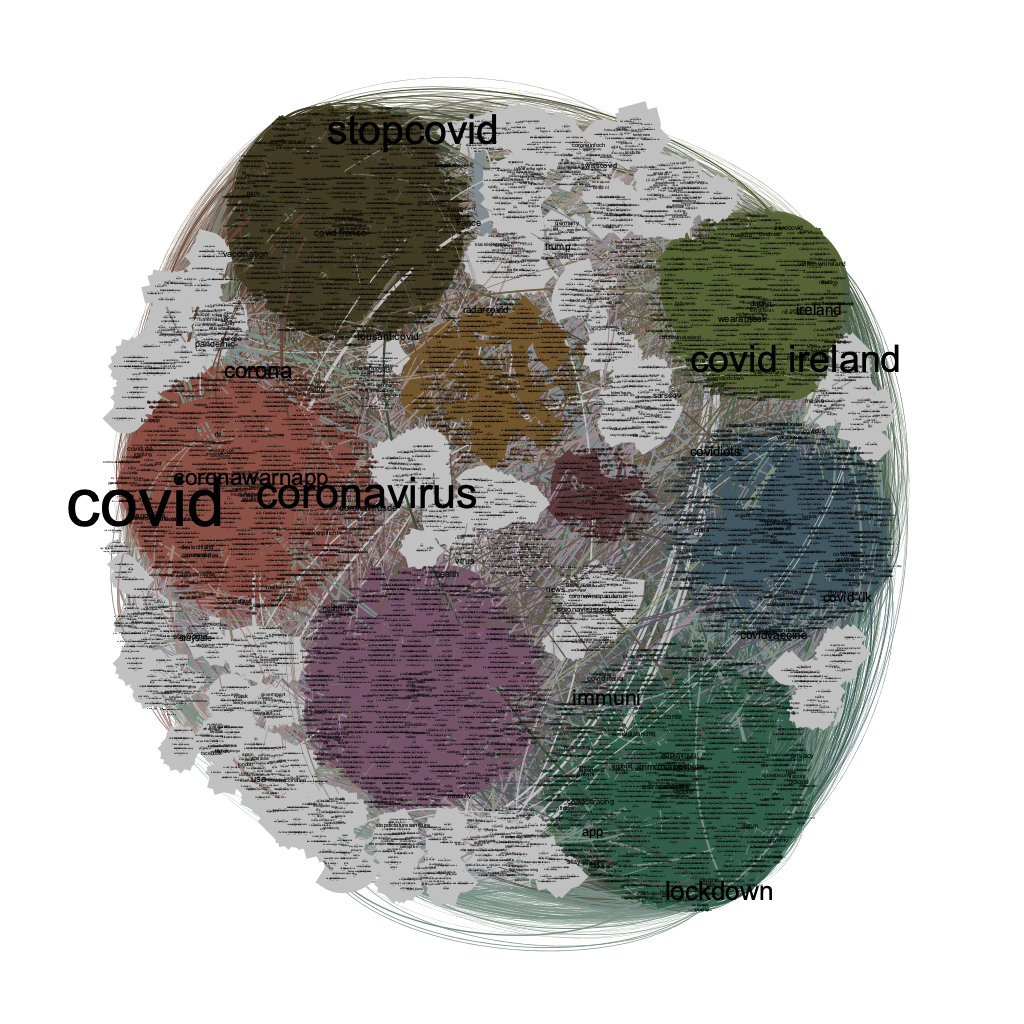
Figure 1 shows the hashtag network of around 260,000 tweets about mobile contact tracing apps. The tweets were collected from July 2020 to June 2021 using the official Twitter APIs.
The size of the nodes denotes the co-occurrence frequency among the node hashtags, which shows how a node may be influential in the network. Different measures can be adopted in Social Network Analysis (SNA) to extract the centrality of a node in order to identify an influential node. We adopted as centrality measurement the degree centrality, which shows how many connections an hashtags has.
Please notice that small communities with a few nodes and low density have been pruned from the network in order to have a clearer network overview.
Each colour represents a community with hashtags that are closely related, that has been identified using the Louvain method [LOUVAIN-2008]. For example, for the purple community the topic seems to be Health and Healthcare. Note that the colours of the communities are selected randomly using standard colour palettes.
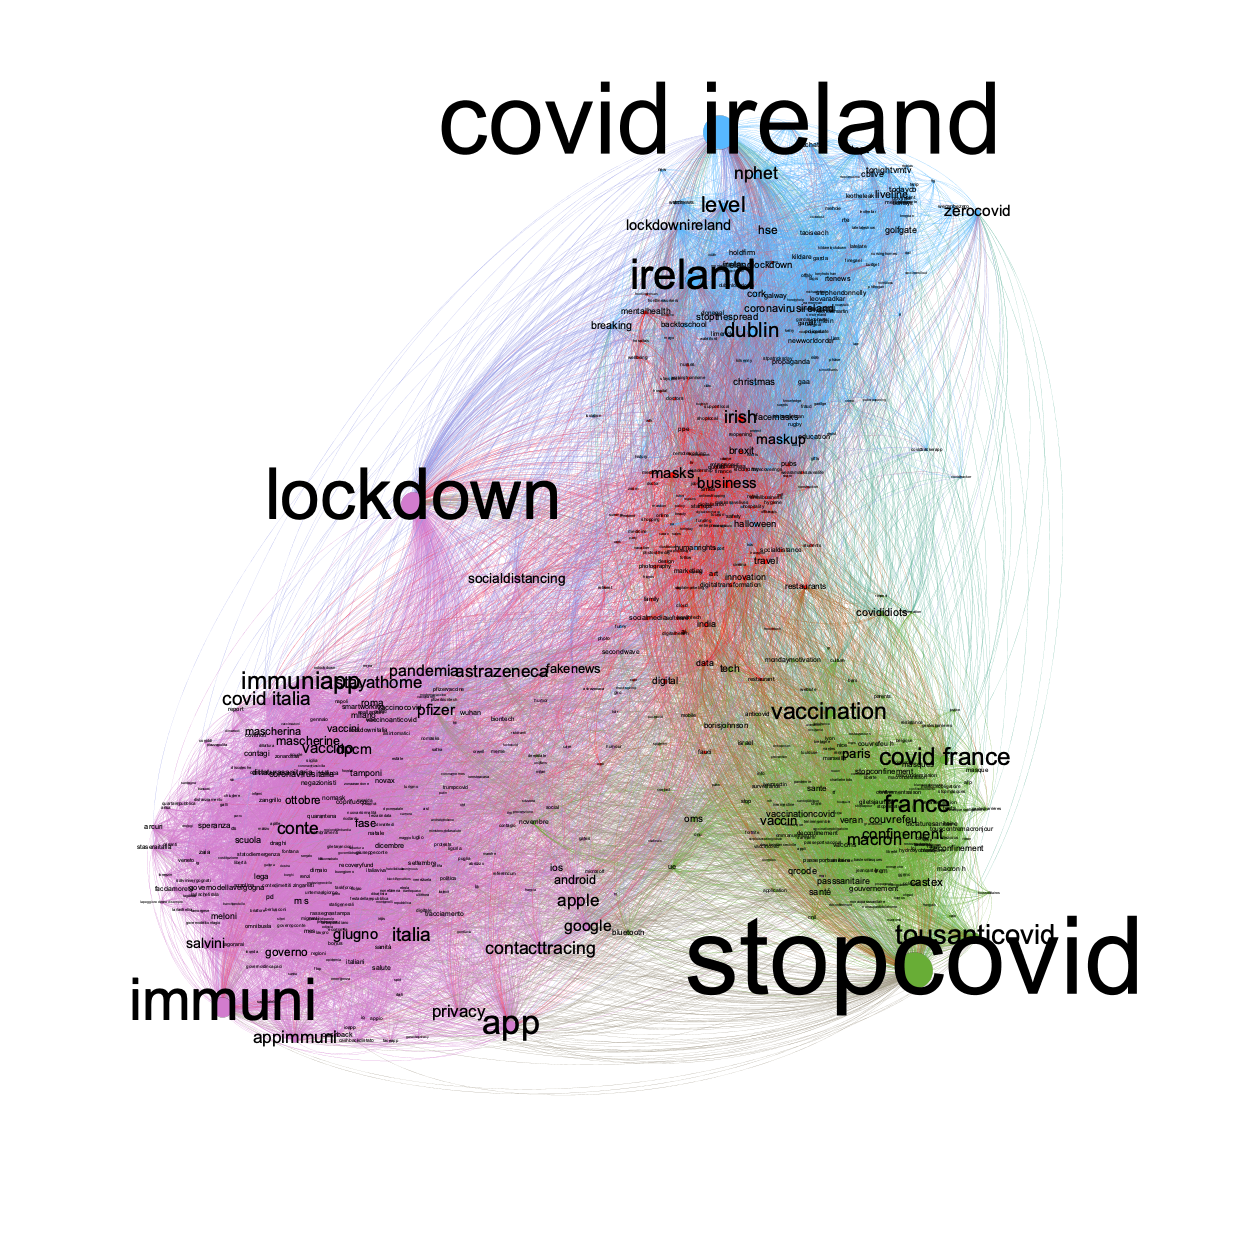
The Louvain method revealed eight main distinct communities, where the central hashtag is usually a contact tracing app name. For example, the dark green community represents the Italian contact tracing app Immuni, and the medium green community the Irish contact tracing app Covid Ireland.
Furthermore, there are small communities in grey colour, where the hashtags are related to most of the themes with political entities or geographic names. Notice, though, that the sixth community in terms of number of tweets is a generic one, covering covid-19 related issues in the society and the economy as well as covid-19 restrictions.
Table 1 displays the all the communities extracted using the [LOUVAIN-2008] algorithm, ordered by the number of hashtags. The communities detected usually represent specific topics, entities or events but it is not easy to extract in an automatic way a single word that describes each community
For this reason, we provide information about the most frequent contact tracing app in the isolated tweets related to each community (specified in the column Main mobile app in Table 1) and the top 5 community hashtags (in the homonym column of Table 1), to show which topics dominate the community. The top 5 hashtags are determined based on the highest value of degree centrality. Note that, since every hashtag may be used in one or more tweets, a community is determined by a set of tweets and the size of the set is reported in the number of tweets column.
On the other hand, a tweet can contain one or more hashtags and a community can share tweets with the other communities. The Isolation index shows how much a community is isolated and it has been calculated as the ratio
Therefore, a high value of the Isolation index indicates a highly isolated community.
Furthermore, to evaluate the accuracy of the detected communities with respect to the global graph, the network density metric has been calculated following the formula:
where n is the number of hashtags (or nodes) and m is the number of edges in the hashtag network. The global network density was with nodes and edges. The range density for the main 8 communities is between 0.016 and 0.051, with an average of 0.026, 5.25 times greater than the overall density, a good indication of separated groups.
Detailed discussions on our observations on the eight more important communities follow, starting with the more generic community that covers covid-19 restrictions and covid-19 related issues in the society and the economy.
Society, economy and restrictions
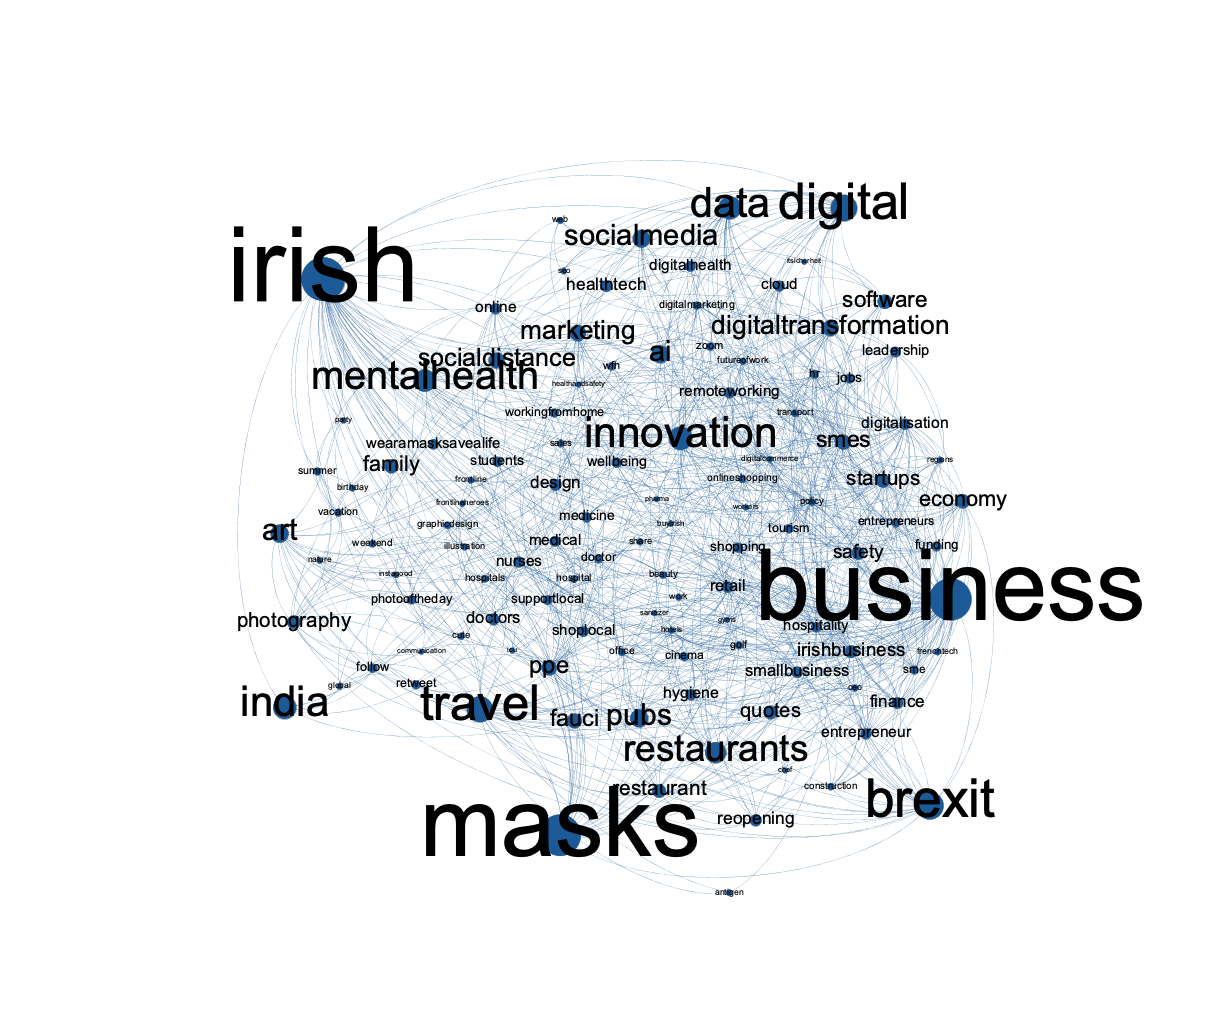
The more generic community detected is, according to Table 1, the sixth in terms of number of hashtags and covers covid-19 restrictions and covid-19 related issues in the society and the economy. The community is not associated with a specific app and the dominant hashtags are Irish, Business and Mask, as is also shown in the hashtag network of Figure 3.
With a low value of isolation index, this community contains many hashtags connected to hashtags that are outside the community. As shown in the sunburst diagrams of Figure 2, 50% of the tweets in this community are isolated, with only 13% of these being geo-located. Moreover, considering the detected relevant EMM news items, they are 38, with 20 of them related with the isolated tweets. At the sentiment level, we see that among the tweets with opinions the neutral tweets dominate both the shared (54%) and the isolated tweets (47%), followed by the negative tweets (31% and 40% respectively) and the positive tweets (15% and 13% respectively).
The observations mentioned above show that the community has many interconnections with the neighbouring communities. Indeed, the interconnection index has a high value and, although it does not refer to a specific mobile contact tracing app, it is well-connected with different apps, as is shown in the hashtag network of Figure 4.
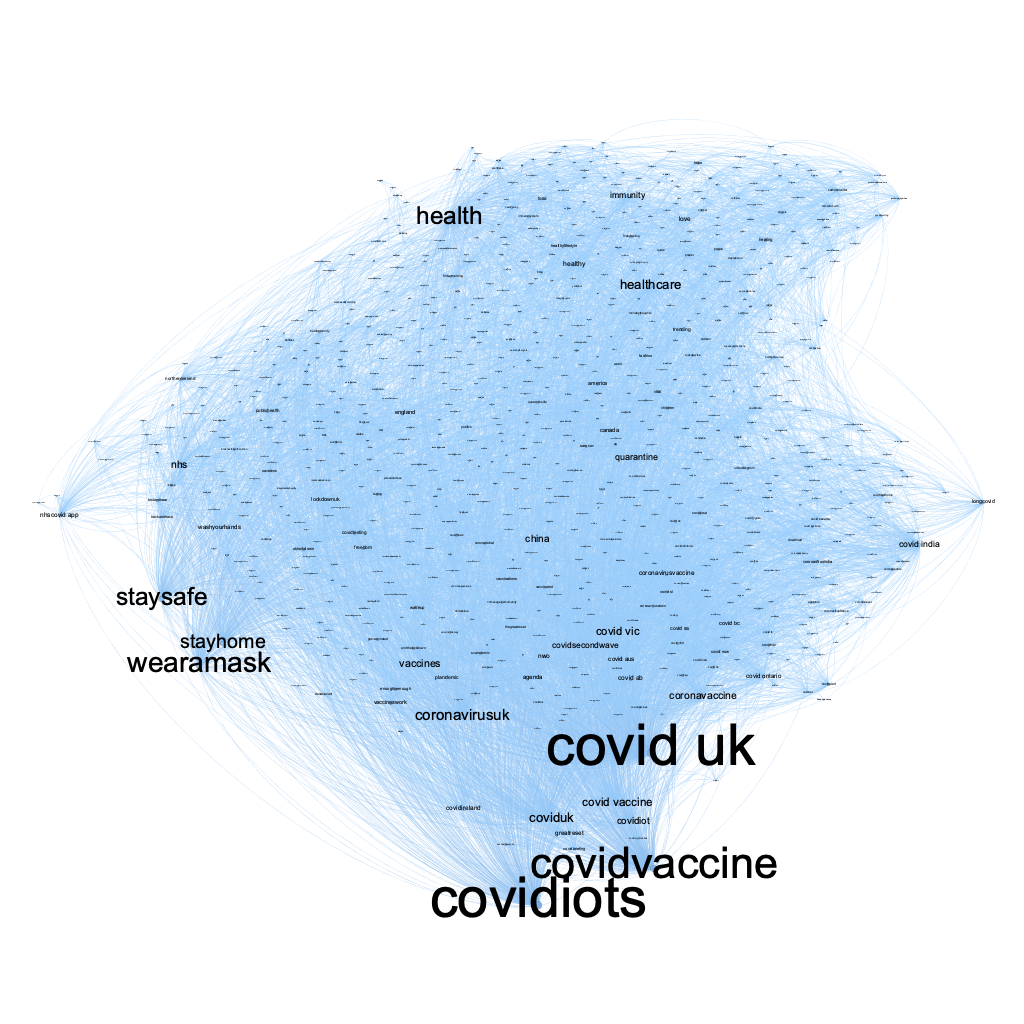
UK NHS Covid 19 app and Covid restrictions
According to Table 1, the first community detected in terms of the number of hashtags is about the UK NHS Covid 19 mobile contact tracing app and Covid restrictions.
With a low value of isolation index, this community contains many hashtags connected to hashtags that are outside the community. As shown in the sunburst diagrams of Figure 5, 19% of the tweets in this community are isolated, with only 6% of these being geo-located. Moreover, considering the detected relevant EMM news items, they are 85, but only two of them are relevant to the isolated tweets. At the sentiment level, we see that among the tweets with opinions the neutral tweets dominate both the shared (51%) and the isolated tweets (47%), followed by the negative (30%) for the shared tweets and the positive (31%) for the isolated tweets; consequently, positive tweets (19%) follow among the shared tweets and negative (22%) among the isolated tweets.
The two observations mentioned above show that the community has many interconnections with the neighbouring communities. Indeed, the interconnection index has a high value and the interesting hashtags that contribute in the interconnections are the following: covidvaccine, wearamask, staysafe, healthcare.
Figure 6 displays the hashtag network about the UK NHS Covid 19UK NHS Covid 19 app and Healthcare community with a total of 1195 hashtags and around ten central nodes with a high value of related hashtags (degree centrality). The topics of the central nodes refer to the spread of the corona virus in UK, healthcare, the vaccines and containment measures.
Relations beetween similar and distance hashtags
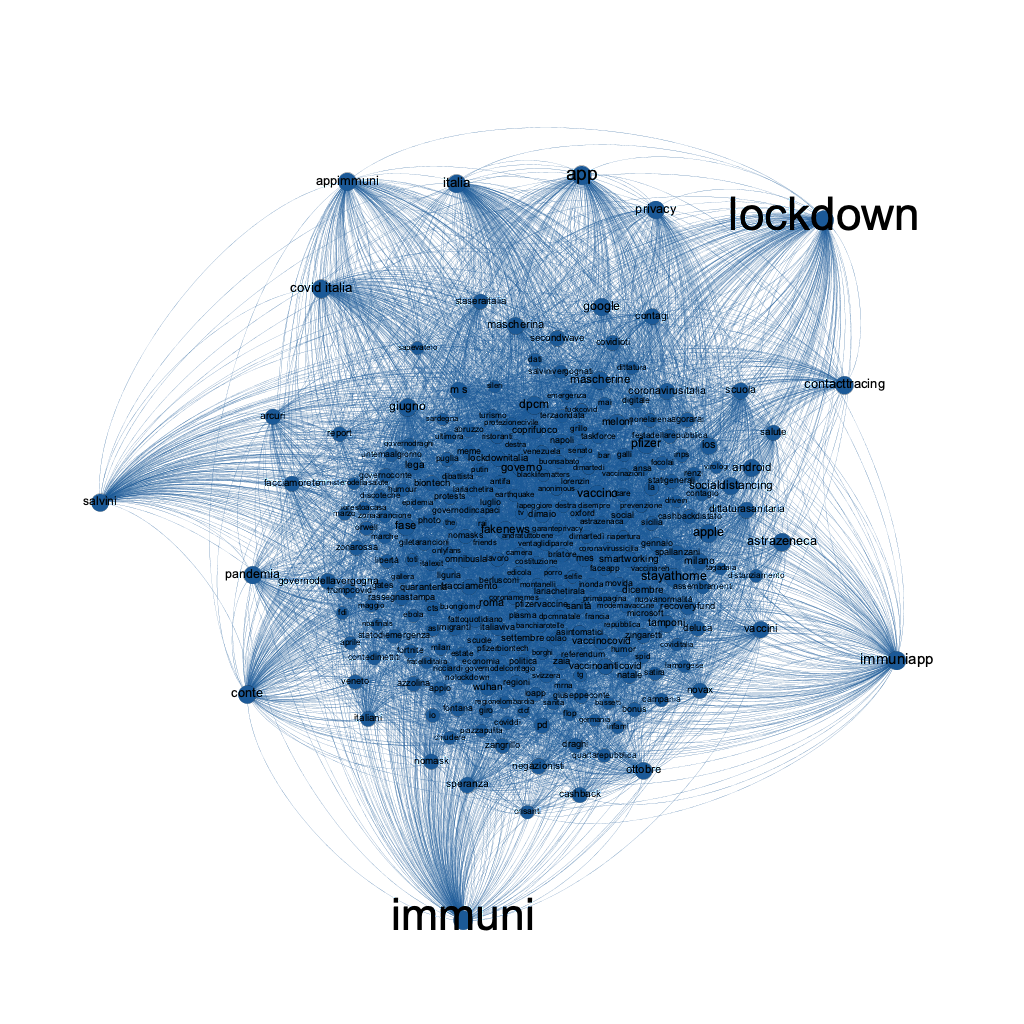
Immuni App
According to Table 1, the second community detected in terms of the number of hashtags is about the Immuni mobile contact tracing app and lockdown.
With a much higher value of isolation index than the first community detected, this community contains less hashtags connected to hashtags that are outside the community. As shown in the sunburst diagrams of Figure 7, 53% of the tweets in this community are isolated, with only 2% of these being geo-located. Moreover, considering the detected relevant EMM news items, they are 30, with 14 of them being relevant with the isolated tweets (notice the much higher proportion of relevant news in isolated tweets versus relevant news compared with the previous community). At the sentiment level, we see that among the tweets with opinions the neutral tweets dominate both the shared (65%) and the isolated tweets (64%), followed by the negative (24% and 27% respectively) and the positive (11% and 9% respectively).
The two observations mentioned above show that the community has many interconnections with the neighbouring communities (but not as many as the first one). Indeed, the interconnection index has a rather high value and the interesting hashtag that mostly contributes in the interconnections is lockdown (which is more popular even than the hashtag immuni).
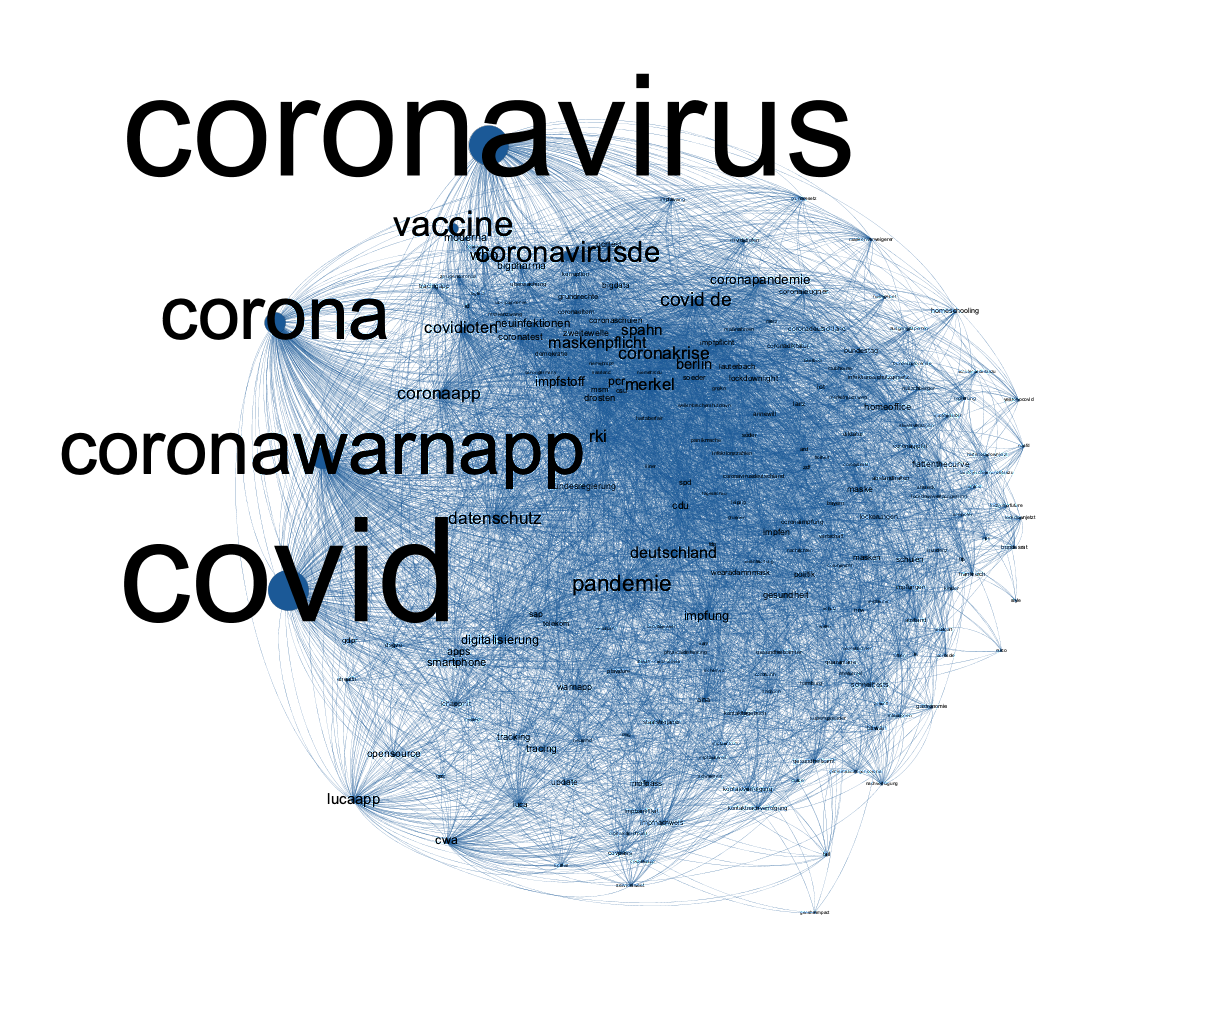
Corona Warn App
The third community detected in terms of number of hashtags (see also Table 1) is about the Corona Warn mobile contact tracing app and corona virus.
With a lower value of isolation index than the second community but still much higher than the first one, this community contains many hashtags connected to hashtags that are outside the community. As shown in the sunburst diagrams of Figure 9, 40% of the tweets in this community are isolated, with only 6% of these being geo-located, while 11% of the shared tweets (60%) are geo-located. Moreover, considering the detected relevant EMM news items, they are 133, with 18 of them being relevant with the isolated tweets (notice the high number of relevant news compared with the previous communities). At the sentiment level, we see that among the tweets with opinions the neutral tweets dominate both the shared (55%) and the isolated tweets (56%), followed by the negative (29% and 35% respectively) and the positive (16% and 9% respectively)
The two observations mentioned above show that the community has many interconnections with the neighbouring communities (but not as many as the first one). Indeed, the interconnection index has a rather high value and the interesting hashtags that mostly contribute in the interconnections are covid, coronavirus and corona (with the first two being more popular even than the hashtag coronawarn and the last as popular as coronawarn).
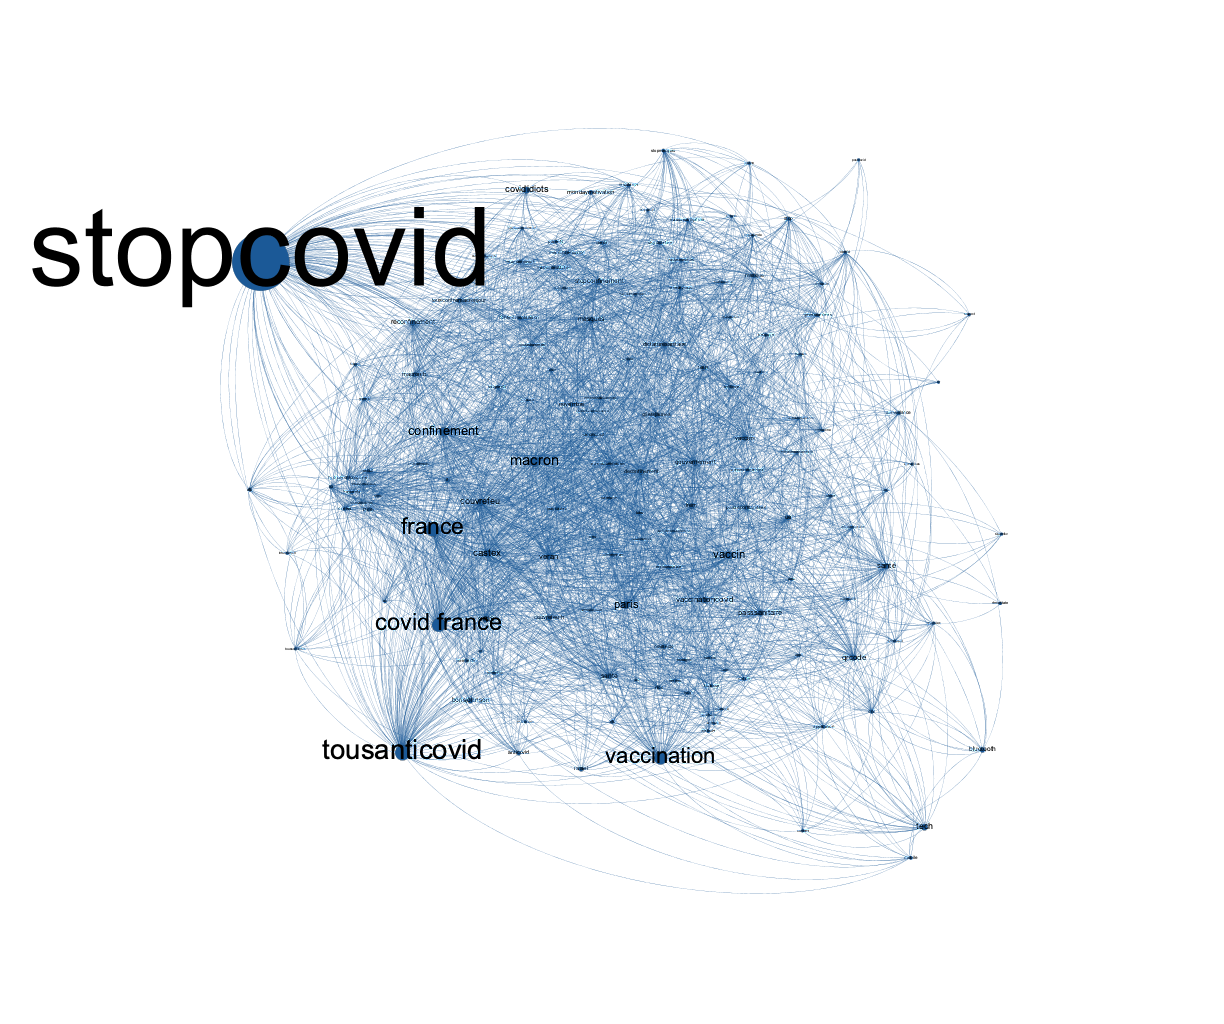
StopCovid
The fourth community detected in terms of number of hashtags, according to Table 1, is about the StopCovid mobile contact tracing app.
With an isolation index value slightly lower than the second community, almost half of the hashtags of this community are connected to hashtags outside the community. As shown in the sunburst diagrams of Figure 11, 49% of the tweets in this community are isolated, with only 5% of these being geo-located, while 10% of the shared tweets (51%) are geo-located. Moreover, considering the detected relevant EMM news items, they are 12, with 6 of them being relevant with the isolated tweets (notice the low number of relevant news items compared with the previous communities and the high proportion of relevant news in isolated tweets). At the sentiment level, we see that among the tweets with opinions the positive tweets (35%) dominate the shared tweets (47% among the tweets with opinions), followed by the neutral (33%) and the negative (32%); regarding the isolated tweets (53% among the tweets with opinions), the negative tweets (49%) dominate, followed by the positive (40%) and the neutral (11%).
The two observations mentioned above show that the community has many interconnections with the neighbouring communities (but not as many as the first one). Indeed, the interconnection index has a rather high value and the interesting hashtags that mostly contribute in the interconnections are france, covidfrance, tousanticovid and vaccination (but none of the hashtags is as popular as stopcovid).
Covid tracker ireland
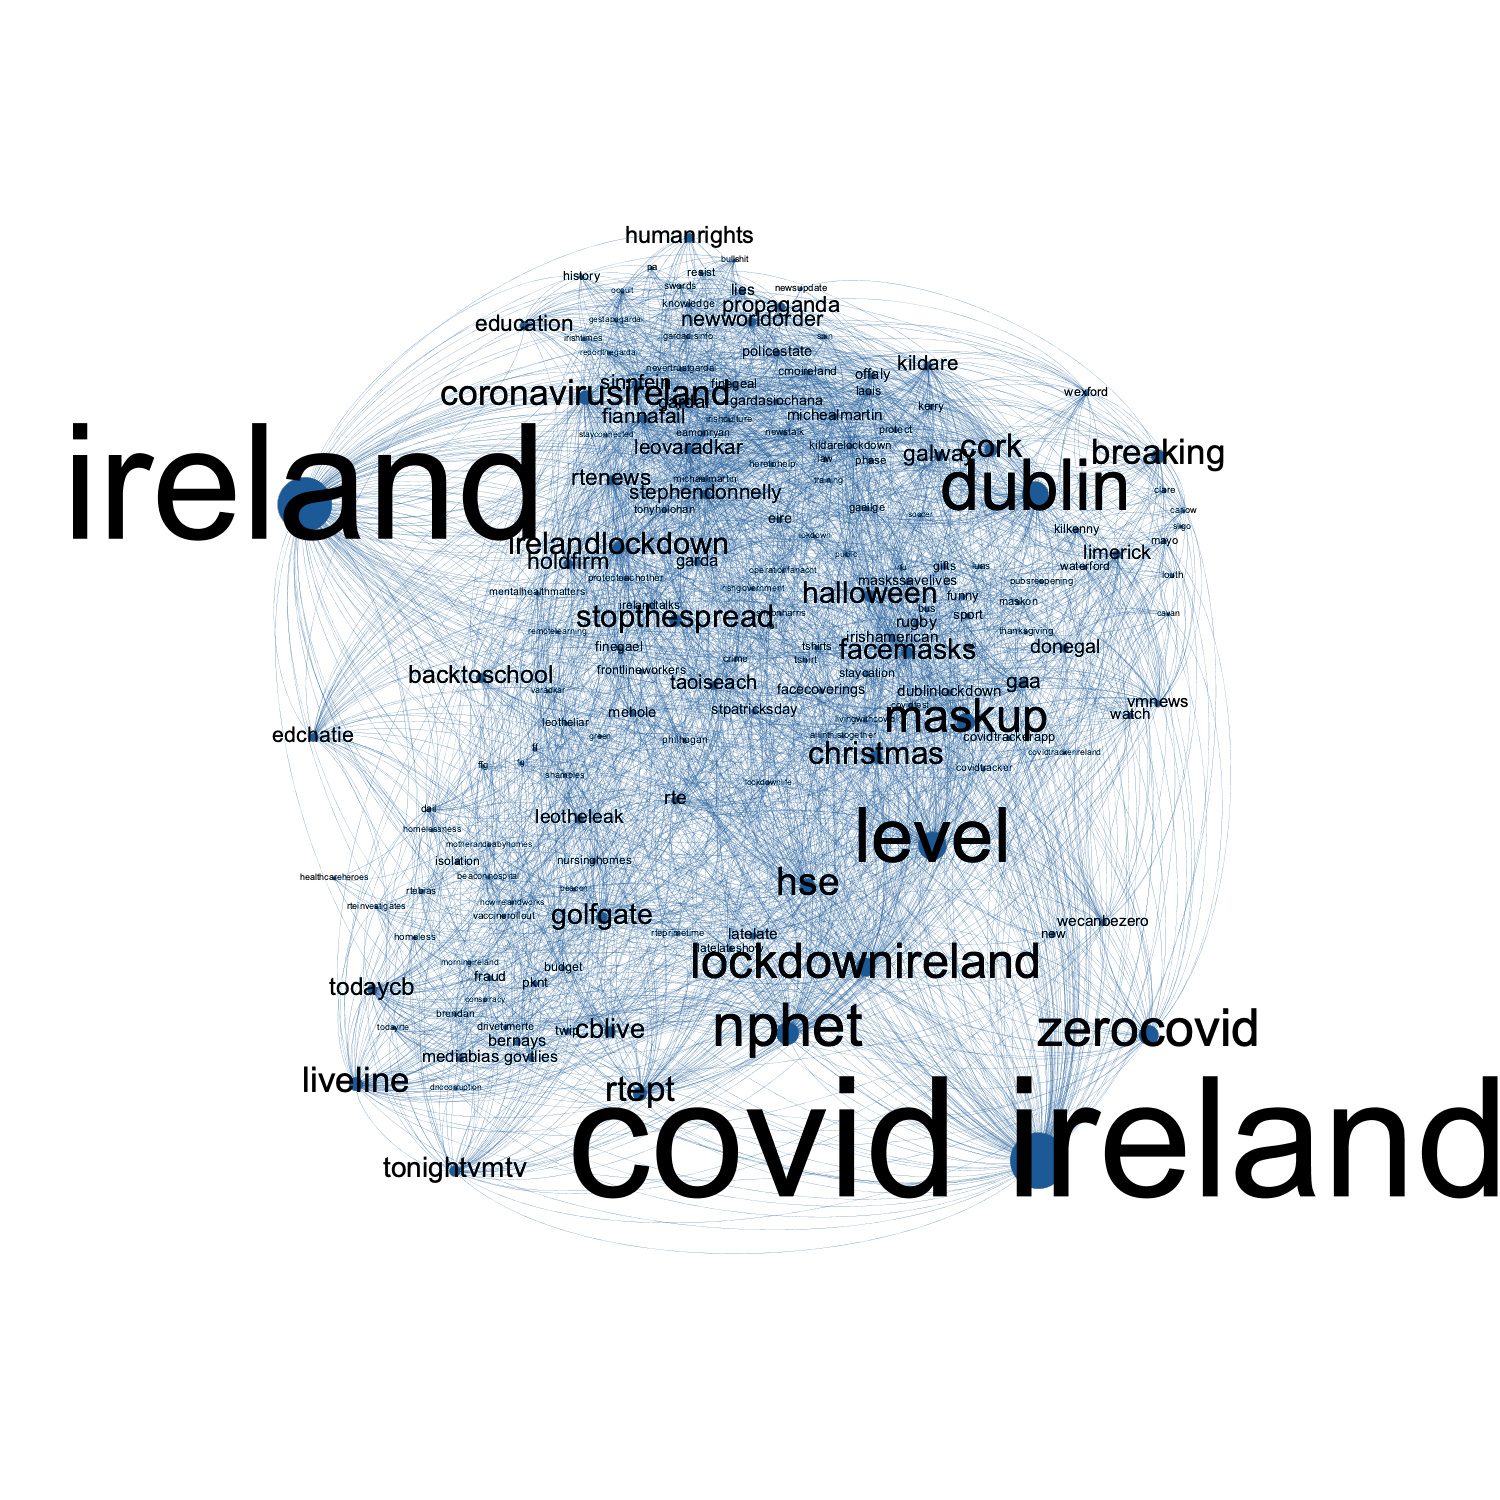
The fifth community detected in terms of number of hashtags (see Table 1) is about the Covid tracker ireland mobile contact tracing app.
With an isolation index value close to that of the second community, almost half of the hashtags of this community are connected to hashtags outside the community. As shown in the sunburst diagrams of Figure 13, 13% of the tweets in this community are isolated, with only 8% of these being geo-located; things don’t change a lot for the shared tweets (87%), where the geo-located tweets are 10%. Moreover, considering the detected relevant EMM news items, they are 38, with 20 of them being relevant with the isolated tweets (notice that the majority of relevant news is relevant with isolated tweets). At the sentiment level, we see that among the tweets with opinions the neutral tweets dominate both the shared (51%) and the isolated tweets (50%), followed by the positive tweets (28%) for the shared tweets (where the negative are 21%), while for the isolated ones the positive and the negative tweets are both 25%.
The two observations mentioned above show that the community has many interconnections with the neighbouring communities. Indeed, it has the highest percentage of shared tweets (87%) and the interconnection index has a high value and the interesting hashtags that mostly contribute in the interconnections are ireland, covid Ireland, Dublin and level.
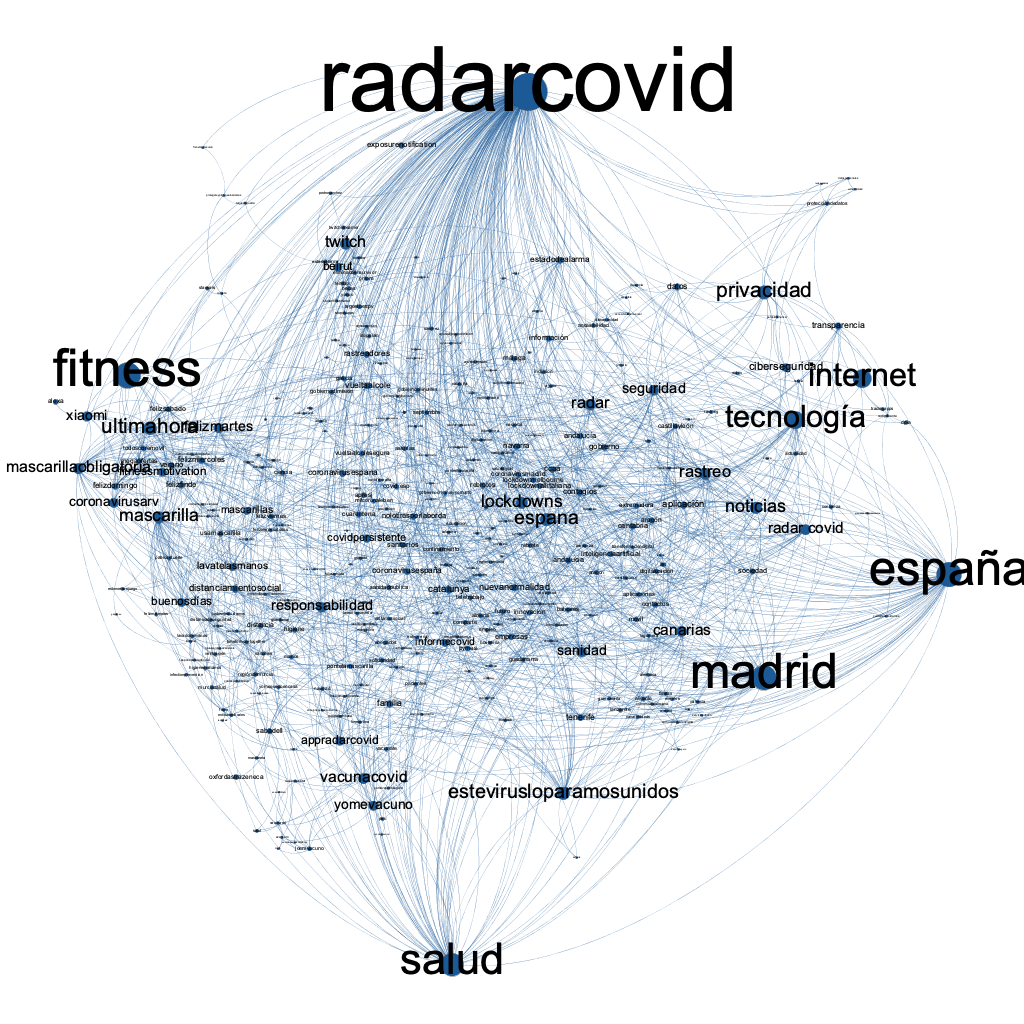
Radar Covid
According to Table 1, the seventh community detected in terms of the number of hashtags is about the Radar Covid mobile contact tracing app.
With a very high value of isolation, this community contains few hashtags connected to hashtags that are outside the community. As shown in the sunburst diagrams of Figure 15, 74% of the tweets in this community are isolated, with only 9% of these being geo-located; things don’t change a lot for the shared tweets (26%), where the geo-located tweets are 8%. Moreover, considering the detected relevant EMM news items, they are two, with one of them being relevant with the isolated tweets (notice the very low number of relevant news items). At the sentiment level, we see that among the tweets with opinions the neutral tweets dominate both the shared (57%) and the isolated tweets (62%), followed by the negative (24% and 25% respectively) and the positive (19% and 13% respectively).
The two observations mentioned above show that the community has few interconnections with the neighbouring communities. Indeed, 74% of the tweets are isolated (the highest percentage of isolated tweets) and the interconnection index has a low value. The interesting hashtags that mostly contribute in the interconnections are radarcovid, fitness, españa, madrid, and salud.